

Introducing - Scottish Football Radars!
Comparing last season's Premiership sides across 12 metrics

One of the godfathers of football finance analysis is an English guy called Kieron, also known as Swiss Ramble. He has over 30,000 subscribers on his website and nearly 250,000 followers on twitter, and for good reason. He produces a fantastic breakdown of finance in football, especially for the mind-blowing sums involved in the English Premier League.
Last week, he released his own financial football radars - based on existing football stats radars which are used to illustrate a player’s quality compared to their peer group. It was a truly brilliant idea, and he has sought out some expert guidance to help him perfect the computer code to allow him to create very detailed financial radars, such as this for Manchester United:
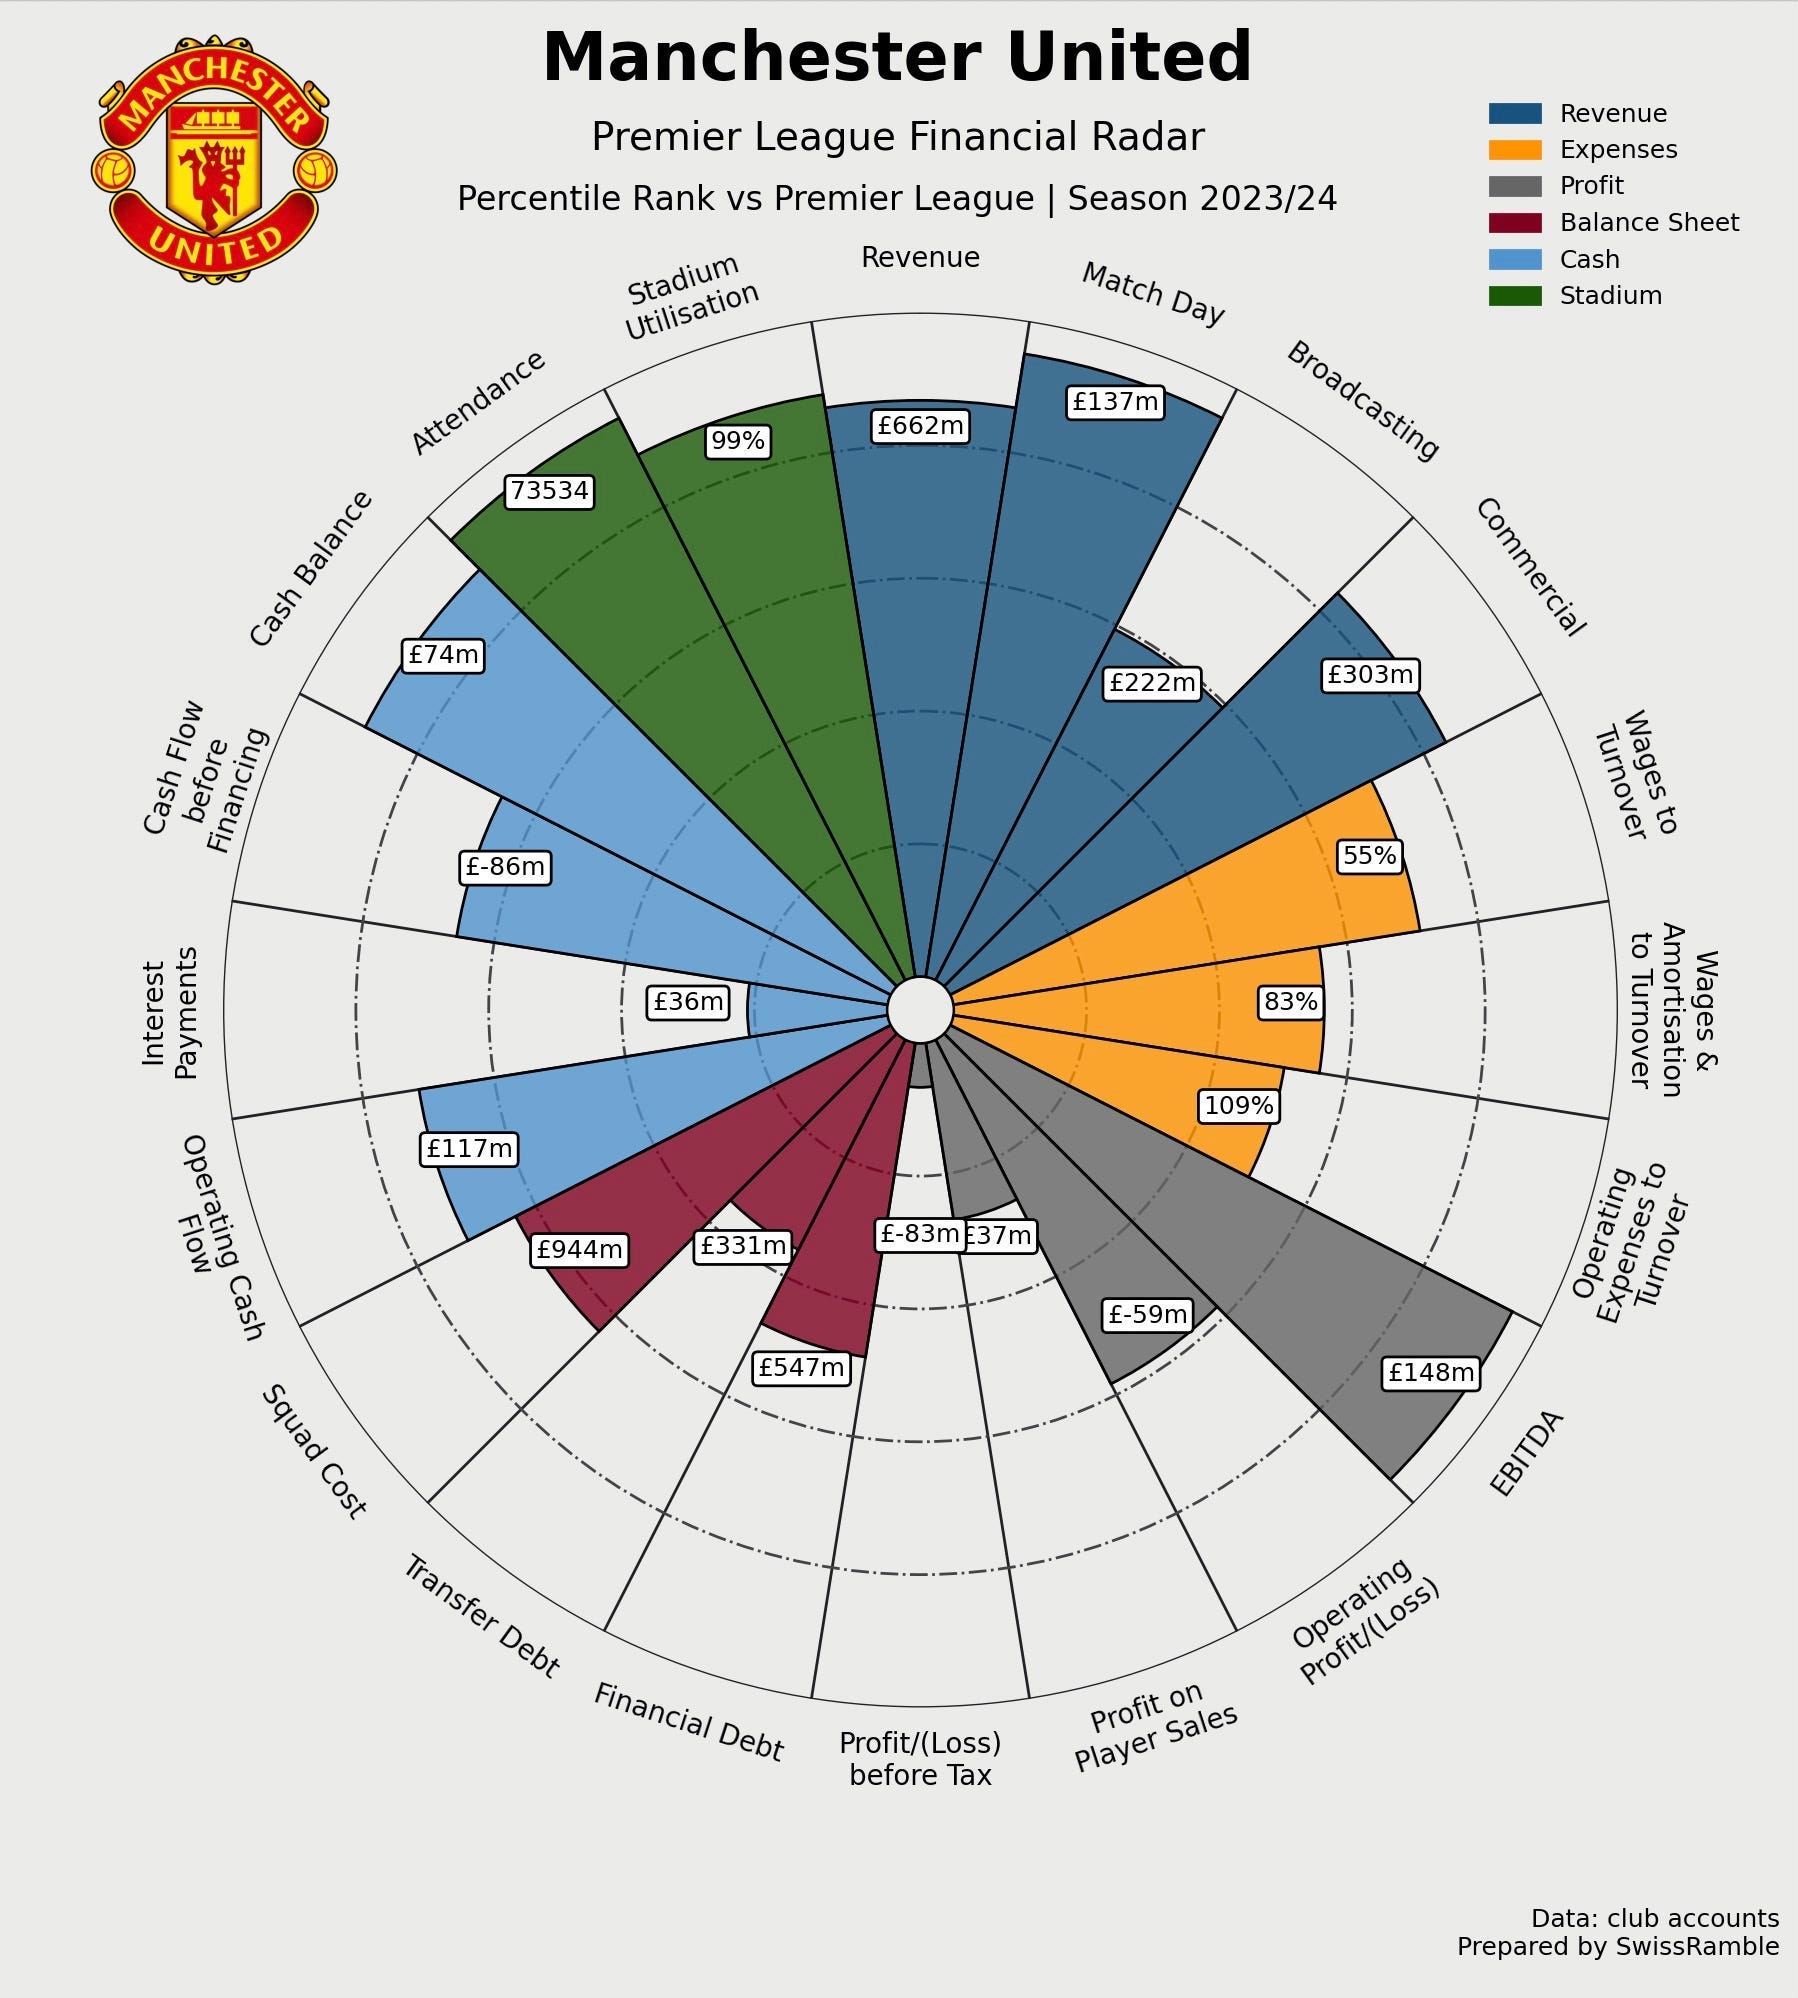
THE POUNDLAND SWISS RAMBLE
I was genuinely impressed and instantly felt inspired to come up with my own concept for the Scottish Premiership. My 50,000 social media followers and 500 subscribers pale in comparison to Swiss Ramble, and it’s fair to say anything I created would be “the Poundland version” of Kieron’s output.
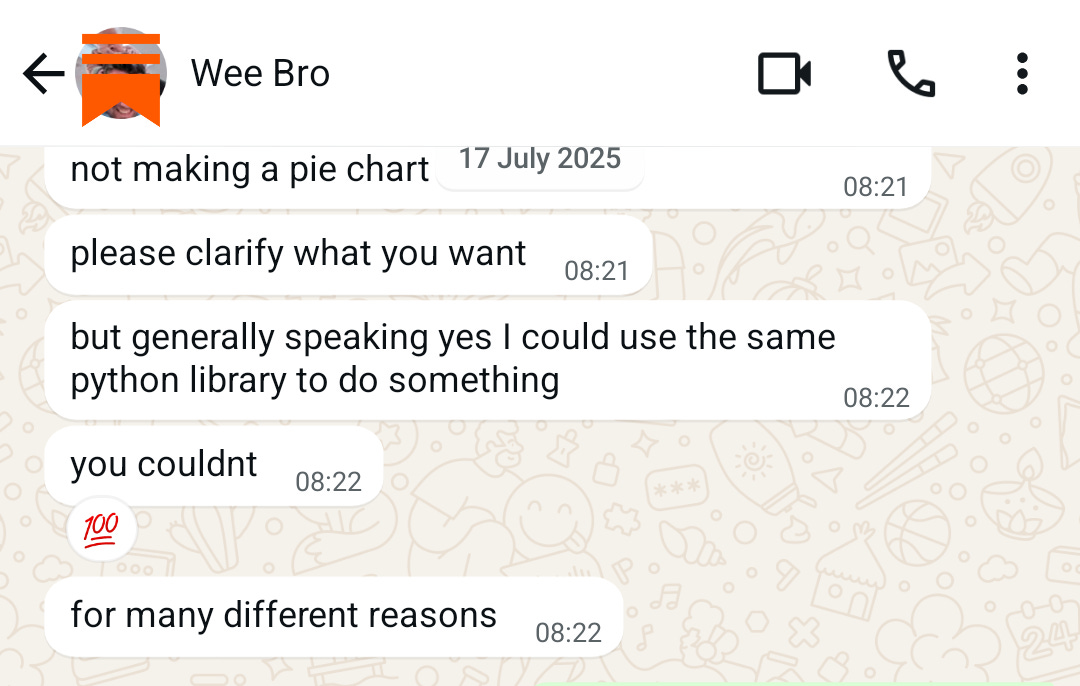
Firstly I have a football hating brother (how can someone be that weird), who “works in IT” - that’s all I know. So I asked him if it would be possible for me (or rather, him) to replicate something based on Kieron’s idea. We didn’t get far.
That avenue turned out to be a dead end and so from there, I decided to instead look to the online Scottish football community, to seek help from someone who knows their way around a football radar. For me there was only one candidate, Kai Watson.
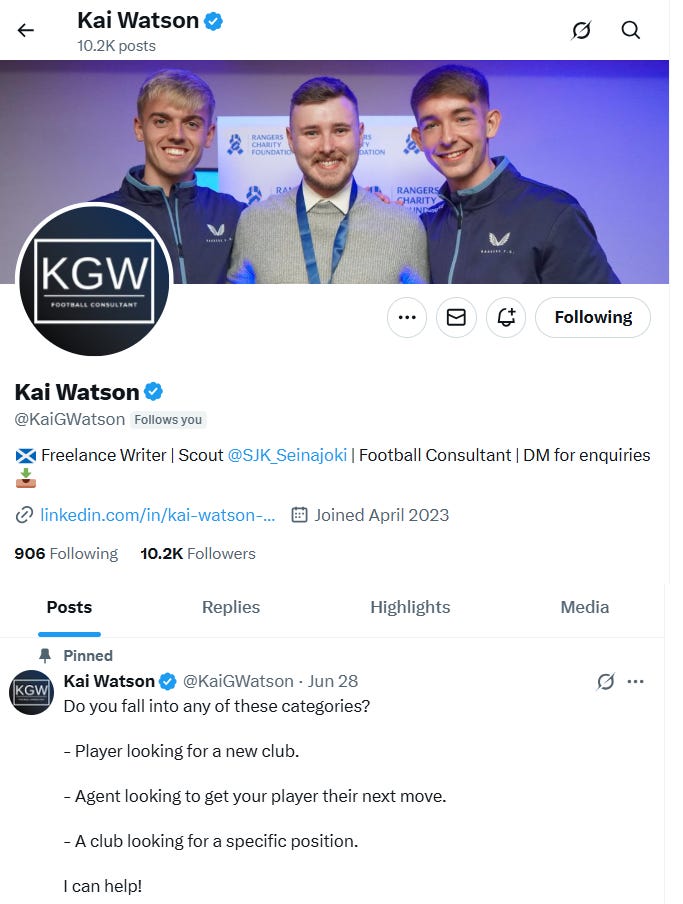
Like myself, Kai is a freelance writer who has built up a five figure following on social media. He has a BsC in sports coaching and performs consultancy work for many clubs, and is a scout for the professional Finnish team, SJK Seinäjoki. However, you most likely know him from his viral threads on twitter, where he evaluates and recommends players based on data and video analysis. His output is now instantly recognisable as a blue radar illustrating the percentile stats for the player, with the detail laid out on on the left hand side.
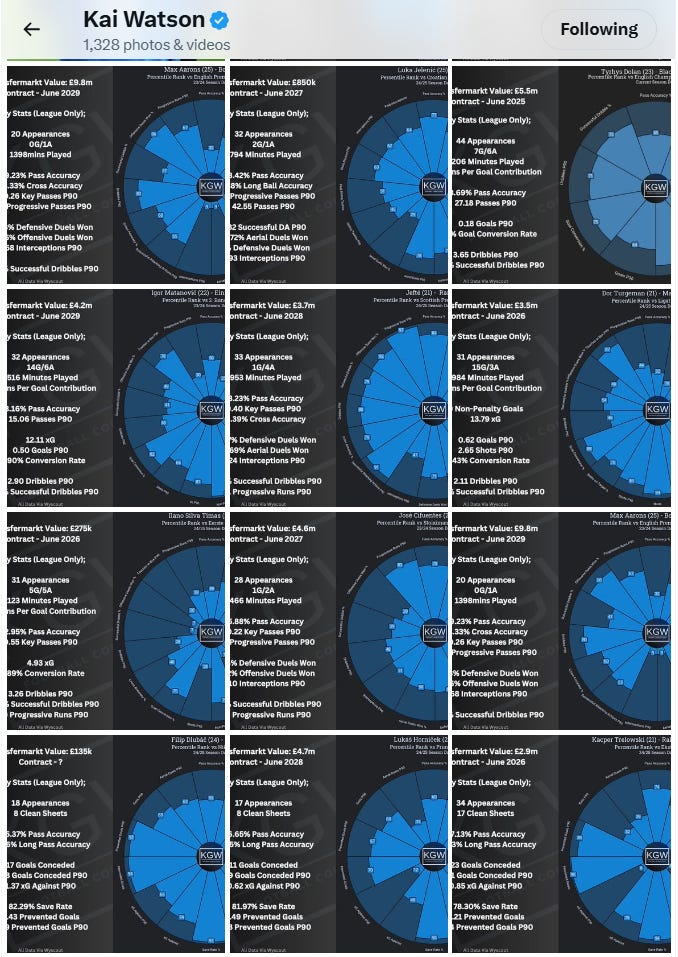
Myself and Kai have chatted online on occasion over the years, so I slid back into his DMs to ask if he would be interested in helping me out. I’m delighted to report that he instantly said yes, and kindly created 12 separate radars for me - based on data I provided for him. My thanks go to Kai, and I would suggest you follow him if you are interested in data and player analysis - he posts regular content covering all Scottish clubs. My thanks also go to Swiss Ramble, for firstly inspiring me to create my own football radars, but then for being kind enough to allow me to copy his idea when I asked for permission!
FOOTBALL RADARS EXPLAINED
A “football radar” chart is simply put a visual way to display how “well” a player has performed, across many different areas of their game. The further out the ‘slice’ or the ‘point’ from the centre, the better the player ranks for that attribute, compared to everyone else in that position.
A well rounded, extremely high quality player would be strong in all areas, with their slice/point for each metric far away from the centre. As an easy comparison to help illustrate the point, here is the radars for Nicolas Kühn of Celtic compared to Greg Kiltie of St. Mirren for last season. Without knowing which player is which, we could instantly guess which player would be the one sold for £16m+ this summer, based on the radars alone.
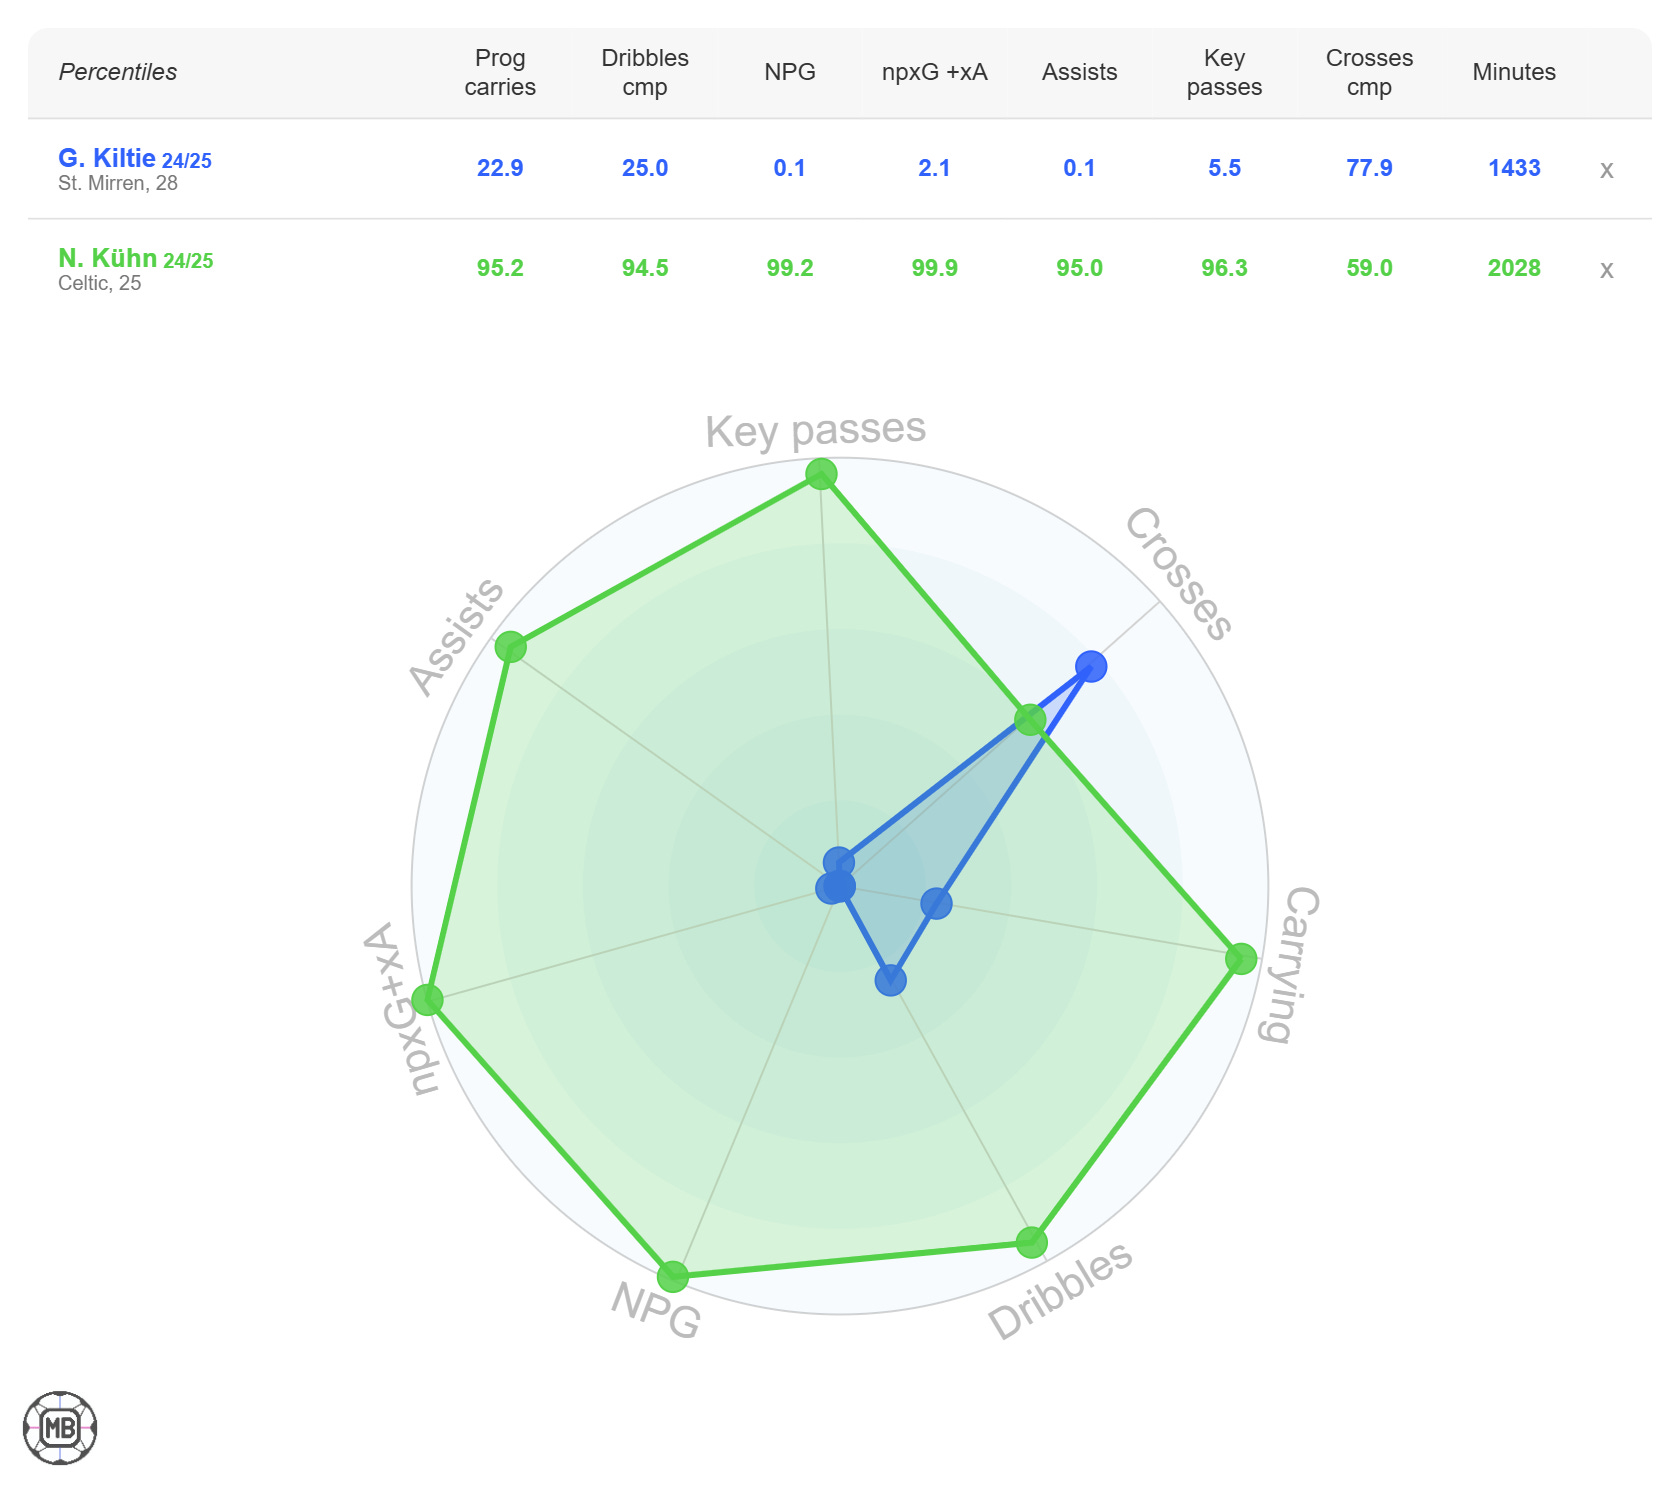
The numbers shown represent the player's percentile ranking — not how many times they performed that action. For example, in the above radar, Kühn didn’t have 95 assists, rather the number of assists he had were higher than 95% of the players in that position.
In contrast, while Kiltie didn’t score or assist, he completed more crosses than 77.9% of the sample. He was in the 77.9th percentile, while Kühn was in the 59th percentile.
Radars of course don’t tell the whole story, and in player recruitment they may be one of many tools used to narrow down a large field of targets, to then be supplemented by actual video analysis and scouting of a player. A ‘poor’ looking radar doesn’t necessary mean the player is a poor performer. For example, while Kiltie’s radar from last season might not be as impressive as Kühn’s, Kiltie wasn’t playing for the best team in the country! He still played 30 matches for St. Mirren, and Saints manager Stephen Robinson said he has been an “integral part” of what the team has achieved in recent years. Last month Kiltie, rejoined Kilmarnock with new manager Kettlewell stating “Greg is a player I've admired for a number of years and he's one I'm confident will fit in well with our squad.”
THE METRICS CHOSEN
Unlike SwissRamble’s radars, which were produced for the financial behemoth that is the English Premier League, the radars in this article will NOT focus solely on financial metrics. This is partly because the accounting requirements for smaller companies mean that not all clubs produce reports that have all the data I would need to exactly replicate Kieron’s idea.
Secondly, the money involved in Scottish football could reasonably be described as insignificant when compared to English clubs, and so a lot of the metrics simply would not be relevant. Many of our clubs might only buy or sell players for actual transfer fees on a very rare occasion, while most have cash balances almost always close to £0. Detailed financial breakdowns are also typically not provided by lots of Scottish clubs.
The annual reports that Rangers and especially Celtic produce are absolutely fantastic, very detailed and provide all the specific financial details I would need. However those two clubs are so far ahead of the rest financially that a comparison to the rest of the league using a broad set of detailed financial metrics would be pointless. A more meaningful exercise might be to compare the Old Firm to similarly sized clubs in other mid-tier European leagues, providing a more relevant European benchmark.
Therefore, instead of a purely financial angle, I have chosen only 12 metrics, covering a variety of different topics, broken down into three main sections:
FINANCES
FANS & SUCCESS
EUROPEAN PERFORMANCE
THE DATA EXPLAINED
FINANCES
Revenue: The revenue reported for 2023/24.
Pre-Tax Profit: The profit/loss reported for 2023/24.
10 Year Profit: The 10 year accumulated profit/loss for 2015-2024.
Total staff costs: The total amount spent on labour in 2023/24 (includes first team players, youth team, analysts, ground staff etc)
Total Wages/Revenue %: The above total wages number as a % of revenue.
I.e. if total wages are £70m and revenue is £100m = this is 70%.
FANS & SUCCESS
Turnstile attendance as a % of Capacity: The actual average numbers of fans that attended according to Police Scotland as a % of the stadium capacity.
I.e. if Police Scotland were told 7,000 attended in a 10,000 seater stadium = 70%Paid Average Attendance: The average attendance numbers as released by the clubs, which include season ticket holders that did not attend.
Major trophies won: The total number of top tier leagues, Scottish Cups, League Cups & European trophies the club has won.
EUROPEAN PERFORMANCE
European Last Eight: How many times the club has been one of only eight clubs left in any European competition.
European Finals: How many times the club has reached a European final.
European Trophies: How many times the club has won a European trophy.
Coefficient Cup Winners: Not a real metric - included for fun. If the team contributed the most points towards Scotland’s Coefficient in any season since 1955, then they are awarded the make-believe “Coefficient Cup” for that season. There have been 70 seasons of European football, however in some seasons the imaginary coefficient cup was shared and so there are 74 coefficient cup winners in total.
Video: The official Coefficient Cup trophy lift
Without further ado, I am delighted to reveal to you the Scottish Football radar for each of last season’s Scottish Premiership clubs. Figures are from the most recent set of accounts (so DUFC is from a Championship season.)
Celtic’s analysis is up first, giving the most in-depth explanation of the metrics, with the rest of the clubs following, in order of last season’s league position.
CELTIC
Keep reading with a 7-day free trial
Subscribe to Scotland's Coefficient to keep reading this post and get 7 days of free access to the full post archives.