

The Expected Points and Projected Points Tables
What "should" the league table look like now, and what "might" the league table look like by the end of the season?

This article was written for Scottishfootball.info by Data Bhoys, a Celtic fan with a keen interest in data analysis. They have started their own Substack account you can follow, as well as the Data Bhoys account on X.com.
This article is a breakdown of the ‘expected points’ so far this season and ‘projected points’ for how the final table might look.
By now, I think most people are familiar with Expected Goals, or xG. Some people love it, some people hate it. The discourse around whether it is a useful metric or whether it’s a pile of pish usually stems from a misunderstanding of what it is actually trying to measure.
If a team has an xG of 2 in a particular match, that doesn’t necessarily mean they “should” have scored two goals. It means that the shots they took in that particular match had a high probability of yielding at least two goals. It is essentially a measure on chance quality. But understanding the context behind this is crucial.
I’ll use some shots from the recent league derby at Ibrox to try and illustrate this. In the 55th minute, Reo Hatate had a shot from close to thirty yards out that was saved by Jack Butland. The xG on this shot was 0.04, so in other terms the average footballer would have a 4% chance of scoring by shooting from this location.
If a team took thirty shots from this location in a match, the total xG would be 1.2. But that doesn’t change the fact that each of these shots only had a 4% chance of scoring. Looking purely at the xG, it could be assumed that this team created enough chances to merit scoring at least one goal – but with the context provided, it tells you that the chance creation was actually very poor.
High xG numbers can also be a red herring for a different reason. Reo Hatate’s penalty in the 91st minute had an xG of 0.79 (standard for penalties), this was saved and he had another shot with an xG value of 0.65, then this was saved and he had another shot right on the line with an xG value of 0.99. In total, these three shots generated 2.35 xG in the space of a few seconds despite the fact it would be physically impossible to score two goals from this situation.

Some xG models adjust so that only one shot in an attacking phase contributes to the total xG value, but some don’t. Wyscout for example has the xG for that game as 4.26 (Celtic) to 1.68 (Rangers). Without the context of how and why that was generated, it could lead you to believe that Celtic absolutely battered Rangers and that it should have been a hammering. Those of us who watched that game understand that is not what happened.
It is not perfect. But on balance, it is a better proxy for chance creation than simply shots taken or shots on target, because taking a lot of shots from thirty-five yards out does not mean you have created a lot of chances.
Why am I going on about this? Well, it is important to understand exactly what xG is because it is highly relevant when we are talking about Expected Points.
Expected Points is what we can calculate based on probabilities determined by xG for and xG against.
In as simple terms as I can, the hypothesis is “based on the quality of chances created by each team, what is the probability of a win, loss, or draw?”.
In Scottish Football, some may be familiar with this concept from the Twitter/X account TheGersReport who has published Projected Points tables for the past few seasons.
I personally remember it during the 2021/22 season, where their model predicted Celtic to win the title at a stage where Rangers were six points clear.
It has been sorely missed during this turbulent season, and many have turned to resources like the xG table on Fotmob for insights like this.
Here’s the thing.
I’m unfamiliar with how TheGersReport model worked, but it is my understanding that Fotmob’s table incorporates all xG in the mix - penalties is what I’m talking about here.
Whenever I am doing player profiles, especially for strikers, I do not include goals or xG from penalties because it doesn’t have much bearing on overall performance. Penalties are random, noisy events that skew data. It isn’t really reflective of how a team has played in terms of chance creation.
By that principle, my theory was that while including penalty xG may be accurate in determining where the points should have gone in a particular game, non-penalty xG is a better reflection of general performance - and if we want to make a projection going forth as to where teams may finish, it would be misleading to include penalty xG because this is an uncontrollable variable.
So here is what I’ve done.
I have designed a framework for Expected Points, using statistical principles of probability based on non-penalty xG to try and estimate:
A) What the league table should look like based on chance creation for and against
B) What the league table may look like after 38 games taking into account points that have already been won
I won’t profess to fully understand the mathematical principles, after all I am not a professional statistician or analyst (I am just incredibly specky and incredibly determined) – but I do believe this has some value, it correlates to what my expectations were and matches up well to similar exercises.
So, after 30 league games, here is what this model thinks the league table “should” look like.
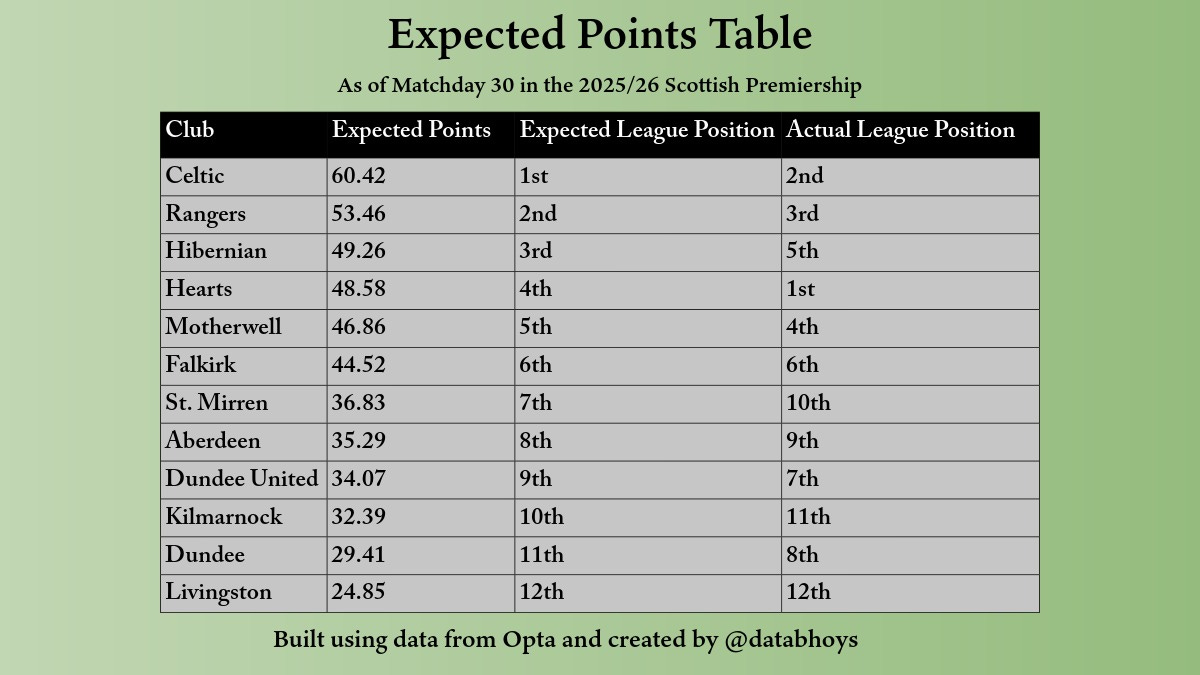
And for clarity, the over/underperformance of each team’s actual points to their expected points.
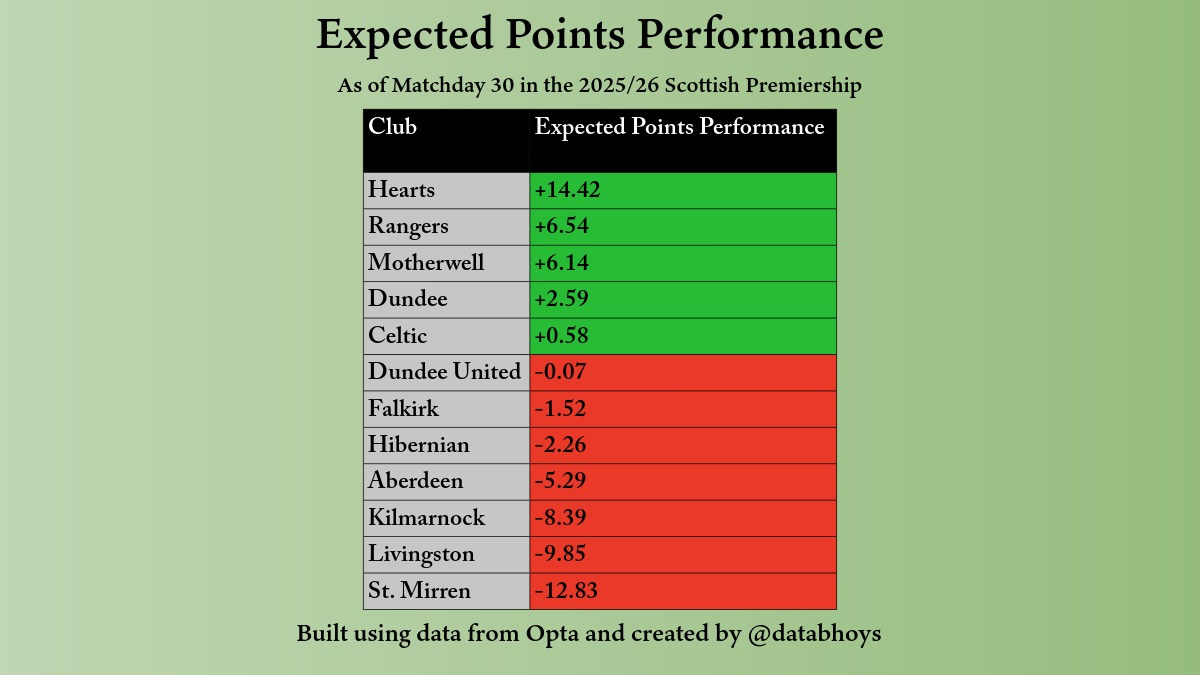
I feel this only furthers the narrative that this has been quite a mad season in Scottish football. Celtic have managed to balance out to just as many points as the model expects them to have, but a massive overperformance from Hearts sees the Jambos sitting top.
Credit must be given to Danny Rohl as I doubt this model would have predicted Rangers to be 2nd before his arrival, but they have benefited from a bit of positive variance on the whole.
There is perhaps a bit of hope for Hibs fans, it feels like a bit of an underwhelming season for them but they can count themselves a little unlucky as their league performances merit 3rd place according to this model.
Motherwell have done fantastically and are a joy to watch, but from this model I would conclude that they have benefited from some variance that sees them with around seven more points than expected.
Falkirk are the only top six side whose actual position reflects their expected position.
Looking at the bottom six, the biggest losers are undoubtedly St. Mirren. Around twelve points less than expected sees them in danger of being dragged into a relegation dogfight.
Livingston are bottom of both the actual and expected tables, but can count themselves a little unlucky as the model has only a four-point gap between them and the side in 11th.
Steven Pressley’s Dundee are the side benefiting most from the underperformance of St.Mirren and Aberdeen, and Dundee United are – well, they are Dundee United I suppose.
With all this, we can now make a projection for how many points each team might finish on, incorporating the findings of this model with the points already on the board.
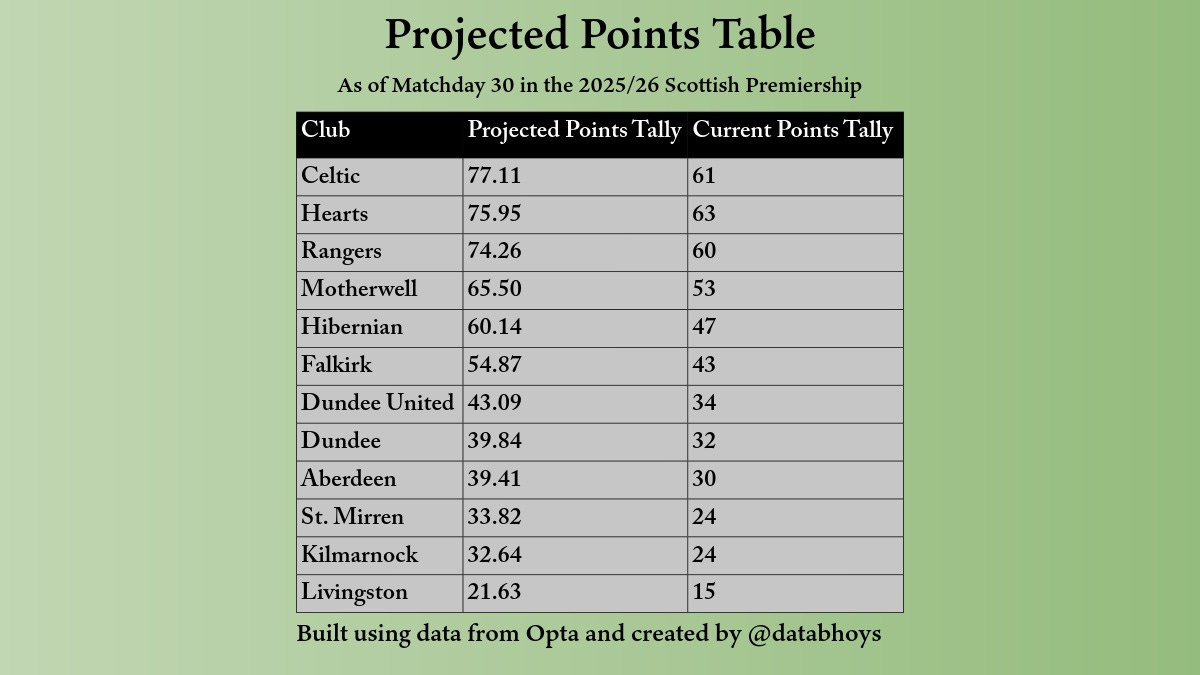
This weekend was a big swing. When I originally calculated these numbers, it was after matchday 29 and Hearts were projected to finish on top – the weekends action now means that Celtic are projected to win the league on around 77 points. This would be the lowest ever points tally for a champion in the modern era.
It’s not quite as simple as that though. Hearts are projected to be on around 75 points, and Rangers around 74 points. That is less than a three-point gap between the top three sides, meaning this title race would be decided on the last game of the season.
The projection for the rest of the league is to stay as it is now – but I think that battle to avoid the relegation playoff place will be very interesting. The model projects only a one-point gap between St.Mirren and Kilmarnock, and this could swing either way.
Now a reminder that this isn’t a prediction or a guess, it is a statistical projection based on underlying performance data. Things can affect games massively that this model cannot account for: penalties, red cards, keepers passing the ball directly into the path of a striker. I have checked this model against both Opta’s and Wyscout’s Expected Points tables, and it is congruent with both - with slight differences due to the inclusion of penalty xG. I am just trying to be a little different here, experimenting, and we will see how this ages very soon!
One thing that I am currently looking into is the possibility of re-jigging this model once we get into the split. For example, if we are trying to project how many points each side in the top six may end up with, might it be sounder basing this projection only on underlying performance vs other top six sides? And vice versa for the bottom six.
It is something I will look into, but until then we still have three massive matchdays to go in this weird and wonderful season of Scottish football. I will try to keep this table updated after every weekend, so if you are interested in seeing how this progresses please feel free to follow me on twitter/X on databhoys.
Thank you for reading and I hope you enjoyed!