

Can Hearts win the title?
Analysing 40 years of champions’ points, goals and xG data to see how Hearts’ run rate stacks up.


Hearts defeated the reigning Champions Celtic at Tynecastle last weekend, to move eight points clear at the top of the table after nine matches - only the second time since 1985 that any time other than the big two from Glasgow have held such a lead at the top. After that match, I explored previous good starts to league campaigns made by non-Glasgow clubs, and the other extremely rare occasions where Celtic start domestic seasons this poorly.
Since last weekend, the Celtic manager has resigned and Hearts’ lead at the top has been cut to six points following their 2-2 draw in Paisley on Wednesday night. As disappointing a result as that was for the new, still undefeated, title challengers, it’s by no means a catastrophe - as clearly no team is going to win the league with 38 victories.
Expectations around Hearts have soared, fuelled not only by their exclusive use of Tony Bloom’s renowned recruitment analytics but also by the sheer rarity of ANY team starting a Scottish season this strongly. On only 14 occasions has a team had 25 points after nine matches (since 3 points for a win was introduced in 1994). The good news for Hearts is that nine of those 14 teams went on to win the league, while four finished in 2nd place. Only one club finished outside the top 2 after such a strong start, and the Aberdeen fans on this website won’t need reminded that it was them, finishing 5th last season.
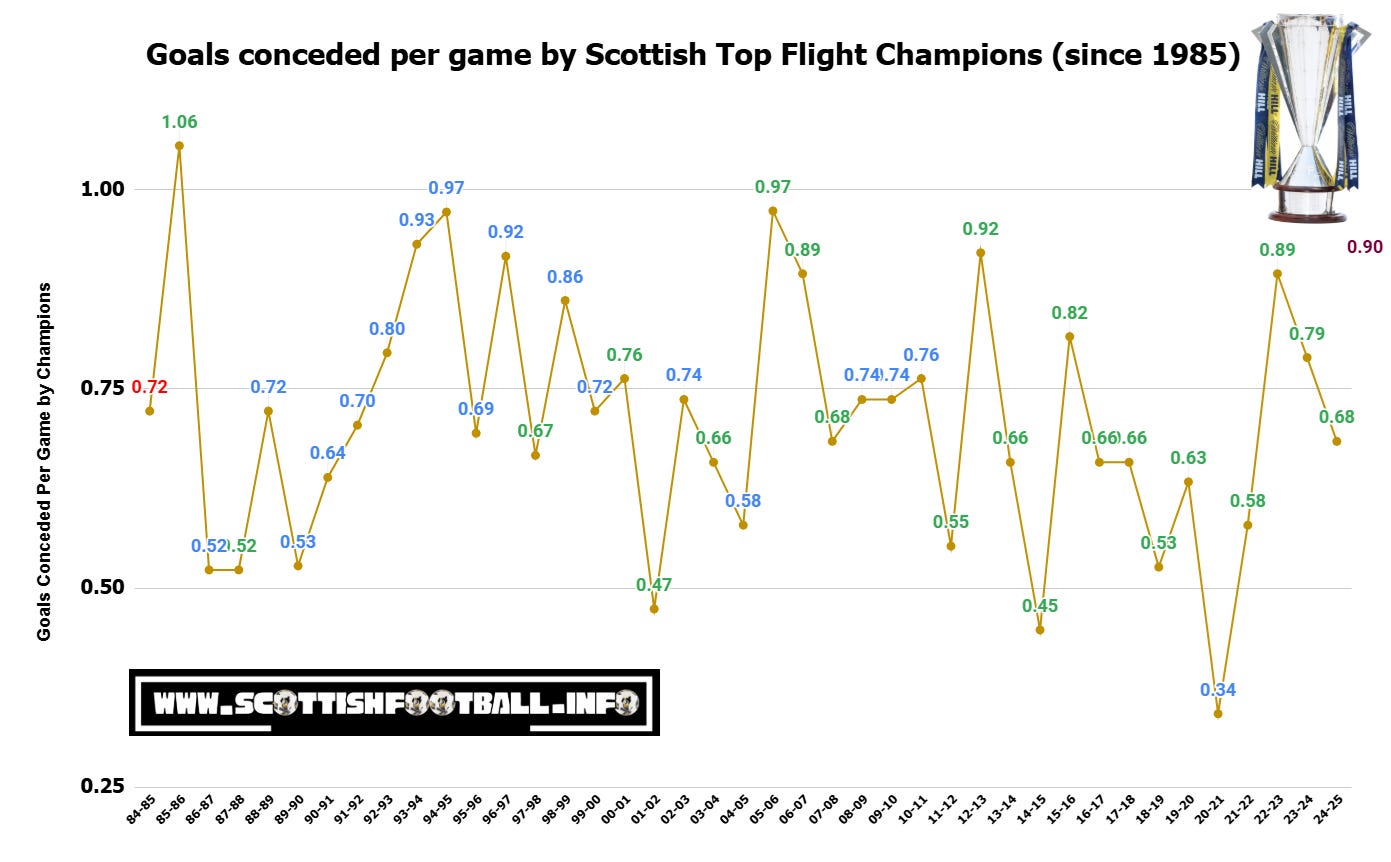
NUMBER OF POINTS EARNED BY CHAMPIONS
The optimism around Hearts stems not only from their outstanding start however, but also from the turmoil elsewhere. Rangers endured the worst start in their history, while Celtic have lurched into crisis - now managerless after a poor opening and an underwhelming transfer window. Since 2012/13, Premiership champions have averaged 92 points, yet with both Old Firm sides faltering, this may be the first season in five that the title is won with fewer than 90 points.
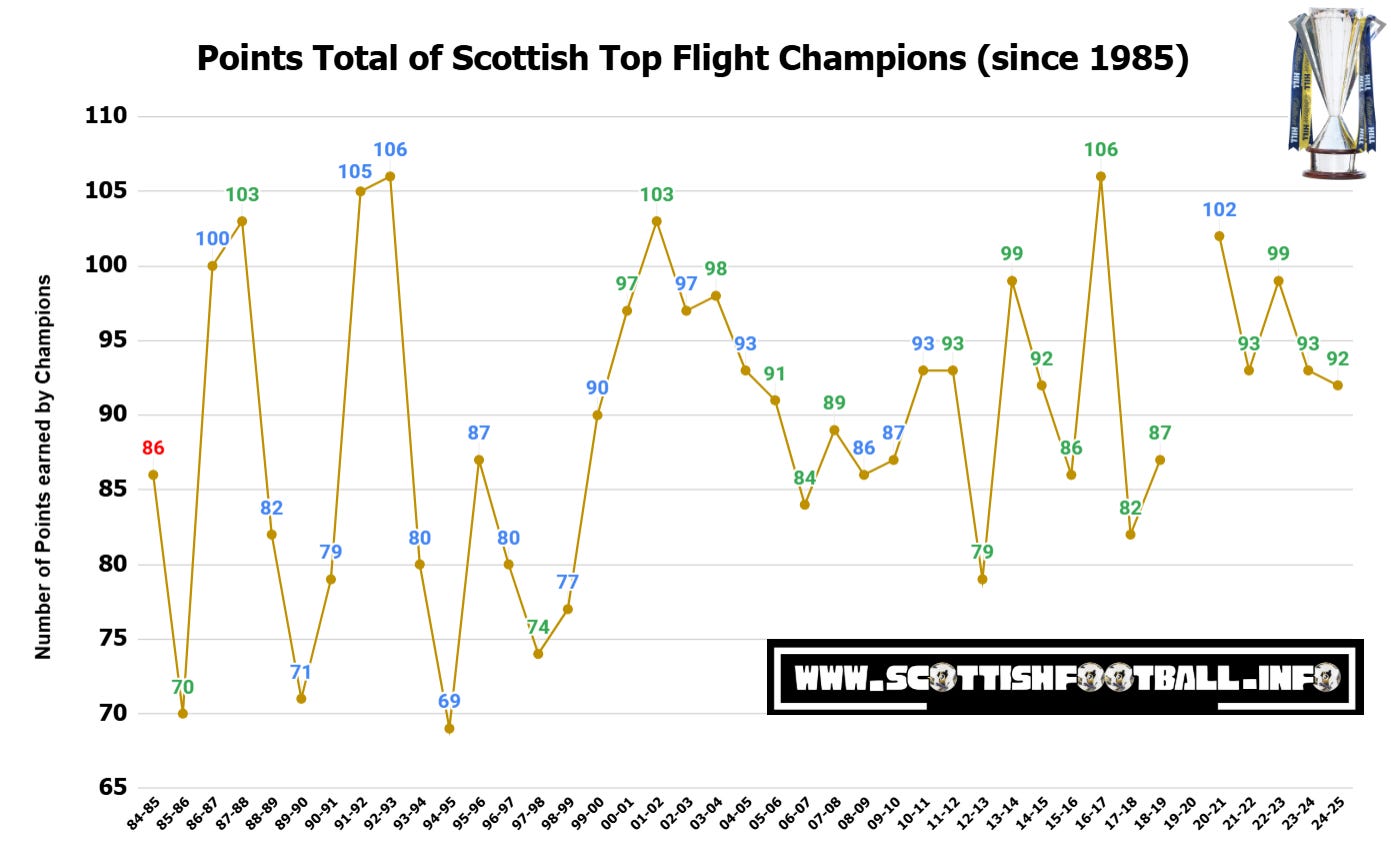
The 2019/20 campaign was curtailed by Covid-19, with final standings decided on a points per game (PPG) basis. That season followed a spell in which the champions had finished below the 90 point mark in three of the previous four years.
The chart above, showing actual points totals over the years, isn’t a perfect like-for-like comparison, as the number of games in a Scottish top flight season has varied between 36, 38 and 44 since 1985. For instance, the lowest title winning tally of 69 points in 1995 came from a 36 game season, while the joint highest of 106 points in 1993 was achieved over 44 matches.
The above chart - actual points total over the years - isn’t a like for like comparison as there have been varying numbers of games in a Scottish top flight season over the last 40 years; 36, 38 or 44 matches. For example the lowest points tally of 69 points in 1995 came during a 36 game season while the joint highest 106 points in 1993 was earned in a 44 game season.
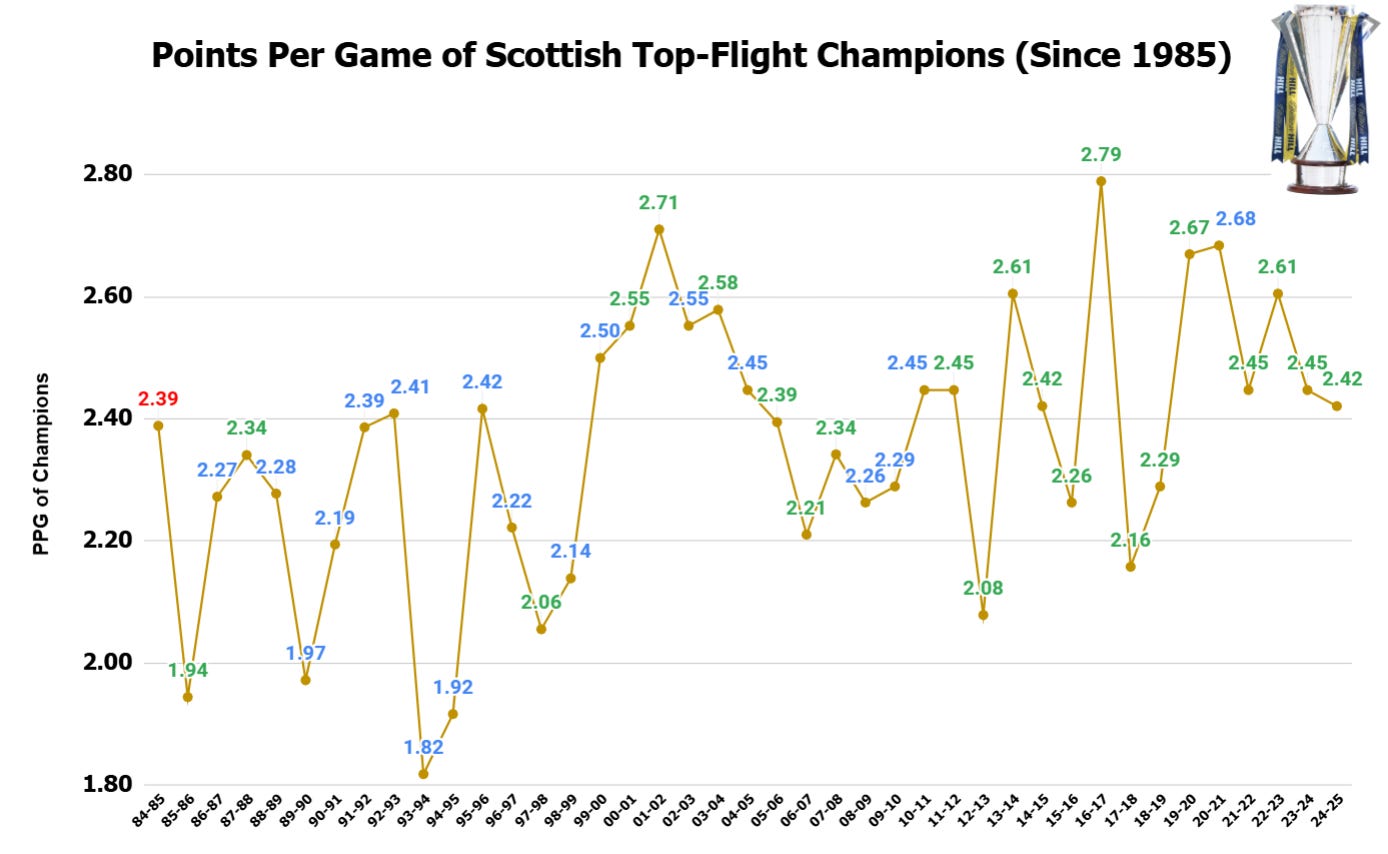
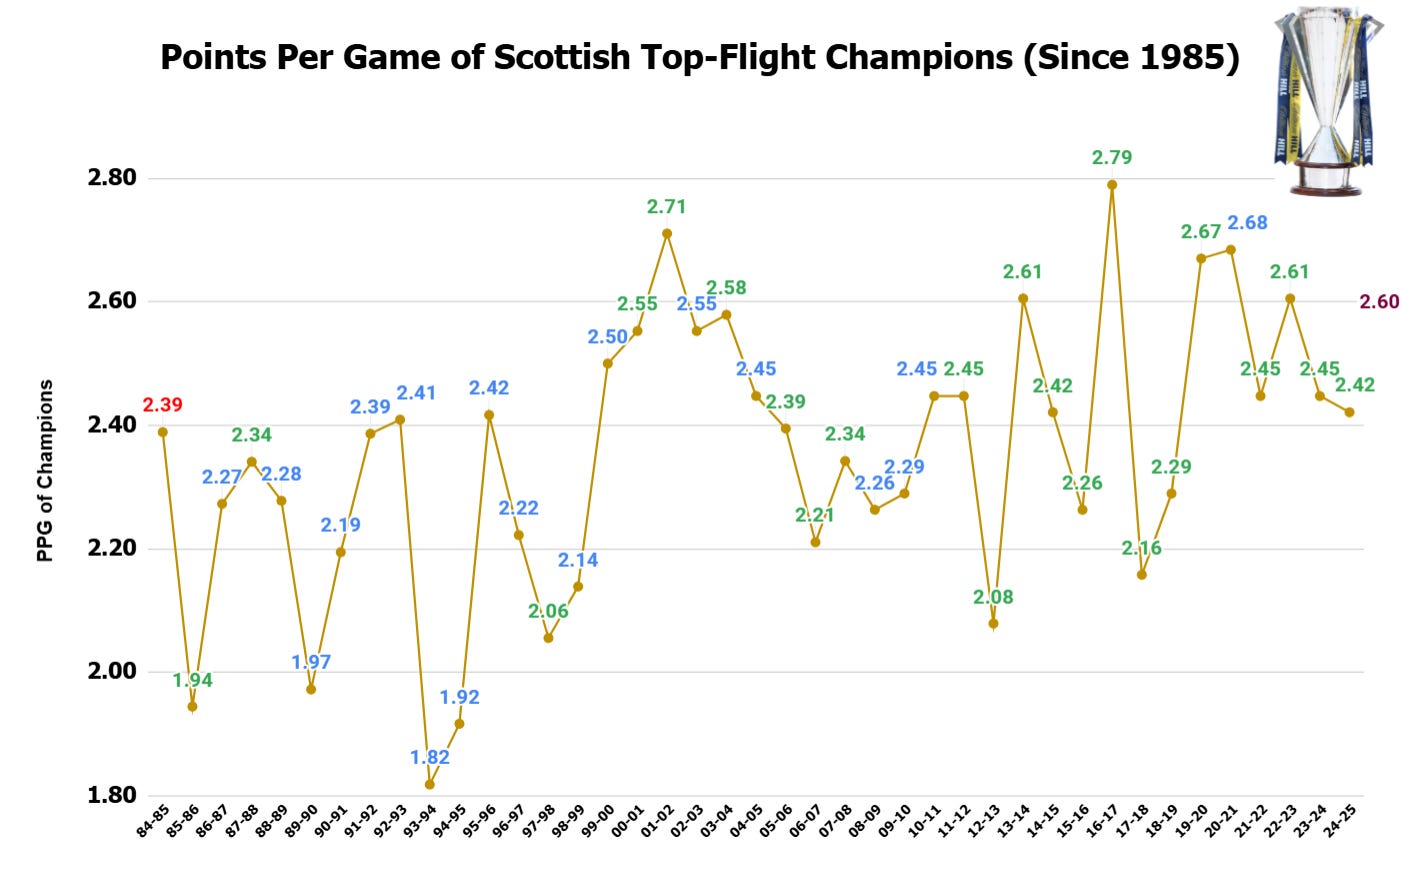
A points per game metric therefore offers a fairer comparison, dividing total points by games played. Since 2012/13, Premiership champions have averaged 2.45 PPG, compared with a long term average of 2.35 since 1984/85.
Beyond points totals, it’s also useful to examine the goals scored and conceded by past champions before assessing how Hearts’ current record compares to those title winning sides.
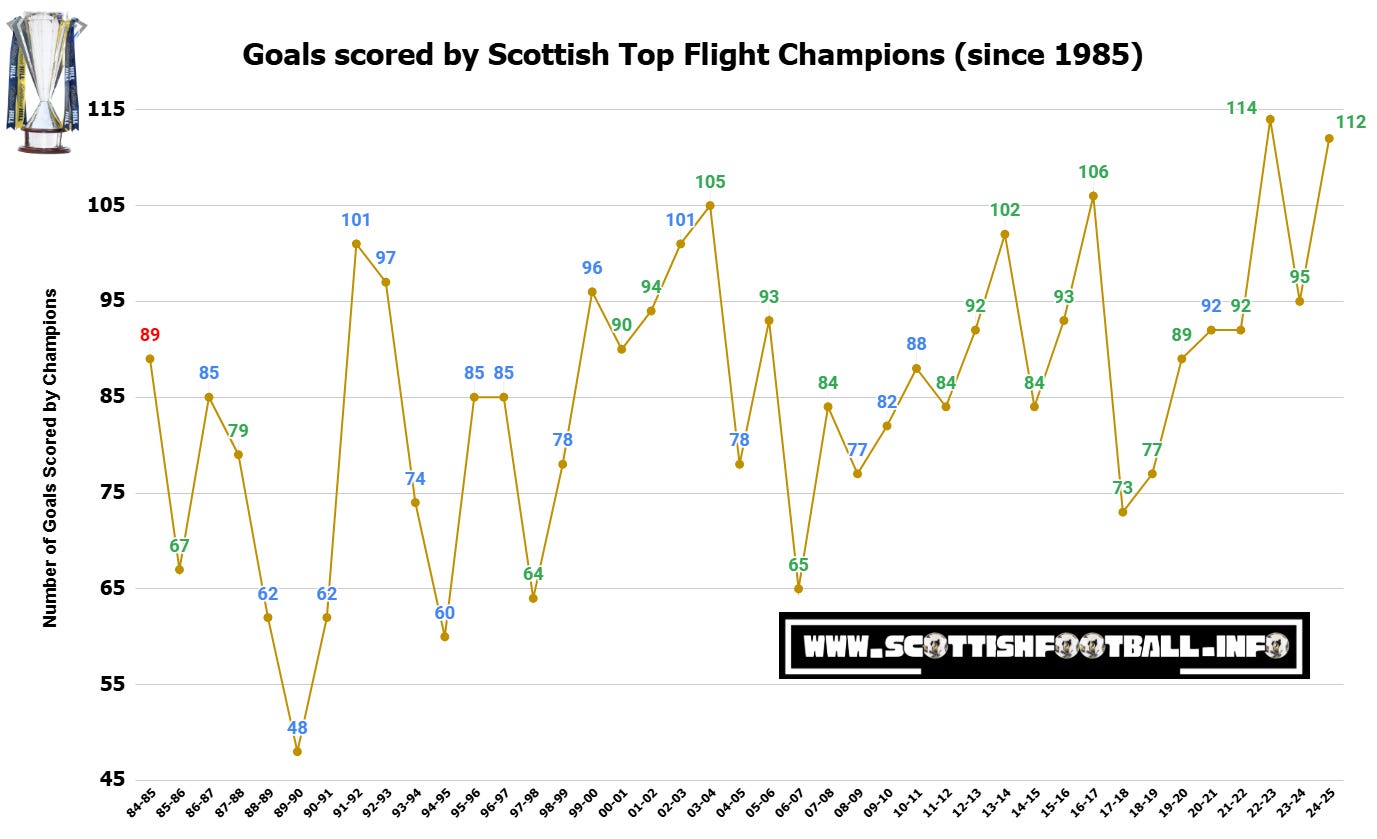
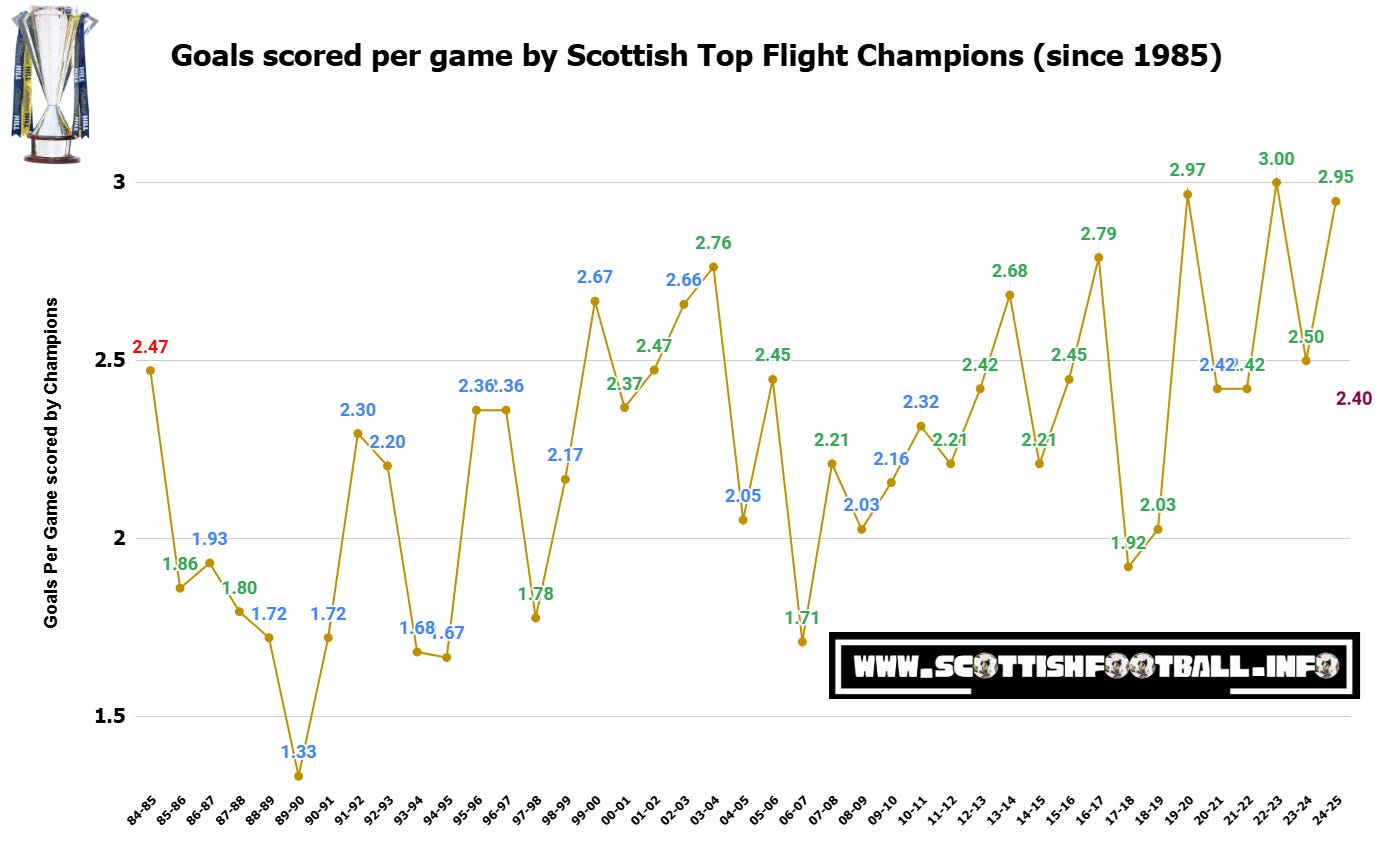
Since the formation of the SPL in 1998, the champions have scored 100 or more goals on just six occasions - five by Celtic: 2024/25 (112), 2021/22 (114), 2016/17 (106), 2013/14 (102) and 2003/04 (105). Rangers have reached triple figures only once, in 2002/03, when their 101 goals secured the title on goal difference on the final day. The average goals scored by champions since Aberdeen’s 1985 triumph is 85.2, rising to 93.9 since 2012/13, boosted by Celtic’s recent 100 goal seasons.
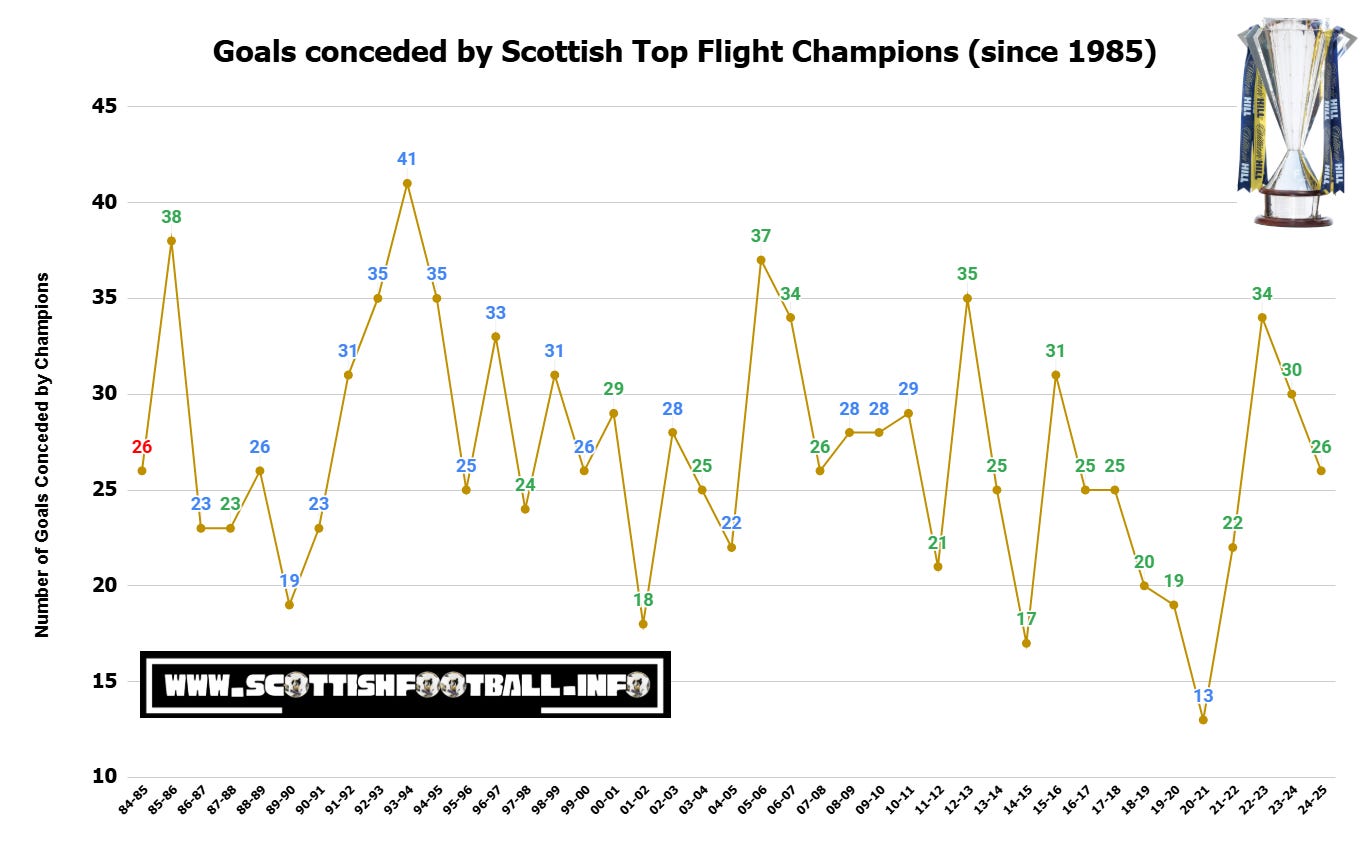
Defensively, champions have conceded an average of 26.9 goals since 1985, dropping to 24.7 since 2013. Rangers’ invincible 2020/21 side set a British record by conceding just 13 goals in 38 games - truly remarkable given they have already shipped 10 in 10 this season.
With champions since 2013 averaging 2.45 points per game, scoring 93.9 goals and conceding only 24.7, how does Hearts’ current form compare?
HEARTS CURRENT PER GAME RATE
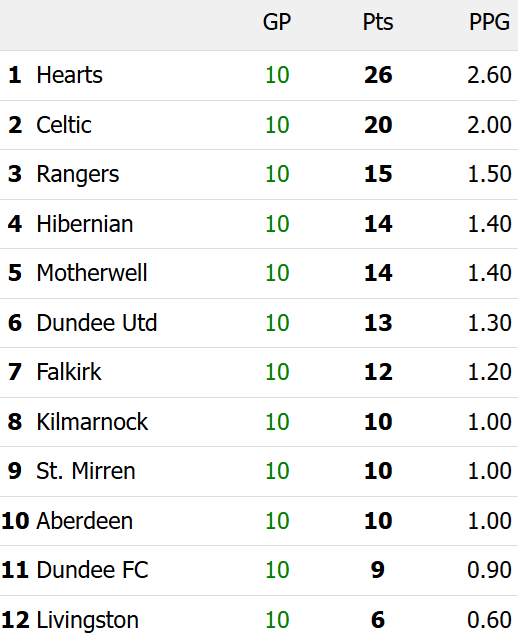
Reigning Champions Celtic are currently averaging 2 points per game, which would not have been enough to win the league in any season since 1995. Hearts, meanwhile, have taken 8 wins and 2 draws from their opening 10 matches, averaging 2.6 PPG - comfortably above the 2.45 average for champions since 2013.
Despite the strong start, a 2.6 PPG would have been enough to win the title in only six of the past ten seasons - which highlights the incredibly high standards set by recent championship winning squads.
If Hearts continued earning points at a 2.6ppg average they'd finish on 98 points. Dropping to a 2.35ppg average would still result in 89 points.
In attack, Hearts have scored 24 goals in 10 games - a rate of 2.4 per match. That’s just below the 2.42 per game achieved by both Steven Gerrard’s title winning Rangers and Ange Postecoglou’s Champions in his first season.
Defensively, Hearts have conceded 9 goals in 10 matches - under one per game - yet still at a higher rate than every title winner since 1998, apart from Celtic in 2005/06 (37 conceded in 38 games) and 2012/13 (35 in 38). Notably, three of Hearts’ nine goals conceded came in a single match against Motherwell, while Hibs, Celtic and Rangers have managed just one goal between them across three matches Vs Hearts.
It’s still early days of course, but Hearts’ numbers so far wouldn’t look out of place alongside the full season records of past champions. The question now is what the underlying data reveals about the sustainability of their performance, are they expected to keep it going?
THE xG TABLE
Most Scottish football fans - excluding those in green and white - would likely relish seeing a new name on the Premiership trophy. It’s been forty years since any club outside the Old Firm were crowned champions of Scotland, which is far, far too long. However, examining the xG table suggests that expectations for the Gorgie side might need to be tempered…
One of the “underlying metrics” which has been around for a long time is xG - (expected goals), a statistical average built from what actually happened in the past. It measures the quality of a chance before the shot is taken. It does not measure the quality of the player’s attempt or if it was actually scored. Each shot is given a value between 0 and 1 based on how likely the chance was to result in a goal, based on real historical data from thousands of similar shots, using factors like distance, angle, type of assist and body part used.
For example, a shot with the foot from 5 yards out might have an xG of 0.8 (an 80% chance of scoring), while a speculative shot from 30 yards might be xG 0.05 (a 5% chance of a goal). This metric helps show how well a team (or individual player) is finishing their chances, rather than just looking at the final score.
Taking it a step further, the xG table ranks teams based on their expected goals in each match rather than the actual results. In this version, a red number indicates a team actually performing below their xG expectations, while a green number shows they’re outperforming them.
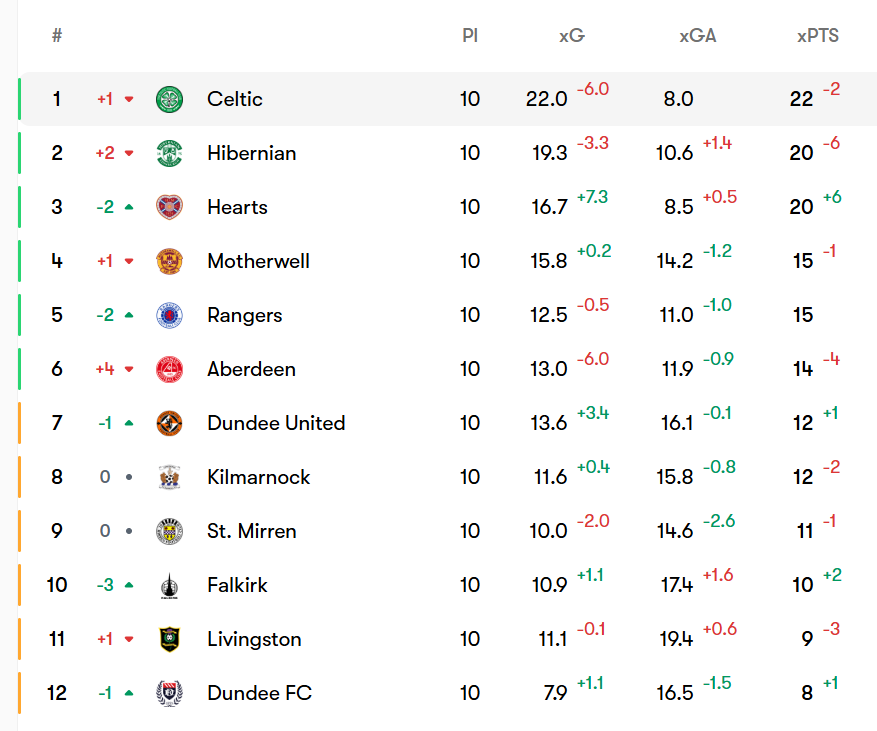
Top of the xG table sit Celtic, shown with a red +1 to indicate they are one place worse in the actual standings (2nd) than xG suggests. They’ve scored 16 goals compared to an expected 22 (a red -6 in the chart) and have 20 points, two fewer than the xG model predicts.
For those hoping to see a new name on the trophy, it’s encouraging that Celtic have slightly underperformed their underlying numbers - as they have less points on the board than expected. However, Hearts’ data may make for more uneasy reading. The Jambos lead the actual Premiership table but sit two places higher than their xG ranking predicts. They have scored 7.3 goals more than expected and earned six points above expectation. In the chart, Hearts’ row is full of green arrows - in complete contrast to Hibs, who have underperformed given the chances they’ve created. The Easter Road side are two places lower than expected and six points worse off than where they should be, according to the model.
While Hearts fans will welcome the fact Celtic have two points fewer than expected, the same model showing Hearts with six more than expected could hint at a possible regression to the mean – in other words, results eventually aligning more closely with the underlying data.
Over a longer sample, (i.e. a full 38 game season), most teams tend to finish near their xG and expected points totals. That could imply Hearts’ form may drop off, while Celtic and Hibs might improve in the months ahead. Aberdeen offered a good recent example of this: after an immense start last season, they were significantly outperforming their xG and xPts figures, which pointed towards a likely decline. Few predicted it would be so severe - finishing as low as 5th – but the model did expect a drop off in points earned.
Of course, xG and xPts are not exact sciences and won’t always accurately predict future performance. Many other variables need considered; elite finishing, individual brilliance, or late winners against the run of play can all combine to push teams above their expected levels. The best players, like the best ever Lionel Messi, – will exceed their individual xG every year, and you wouldn’t worry about his ability to sustain that.
If a team is outperforming their xG then it does not mean they definitely cannot sustain their form.
Lots have naturally drawn parallels between Hearts’ start and Leicester City’s 5000/1 English Premier League triumph in 2015/16. Leicester essentially ran away with the league title that season, benefitting from the extreme rarity that is all of England’s top clubs massively underperforming at the same time – a perfect storm that Hearts fans will hope to see repeated in Scotland this year.
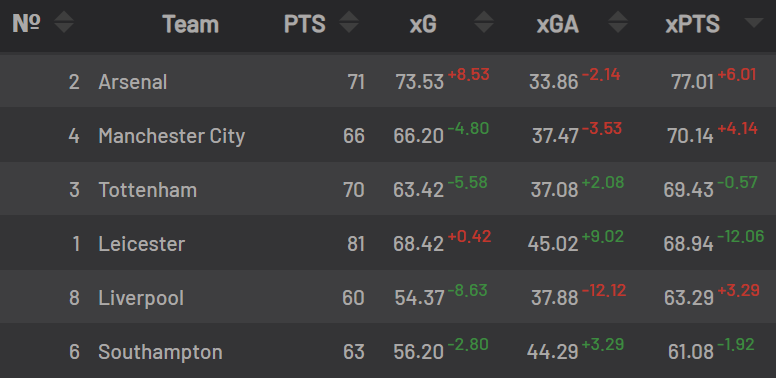
Leicester finished the 2015/16 season on 81 points - ten clear of Arsenal’s 71 - yet the xG table had them only FOURTH. They outperformed their expected points by a massive 12 pts, while Arsenal earned six fewer than expected. Actual points will always matter most, but expected points can offer valuable insight into predicting future performance.
PREDICTED POINTS TABLE
Using underlying data from the matches so far, we could create a predicted points table for how the table might look come the end of the season. Unfortunately, it is beyond my capabilities to make an accurate model for this - and no good sources exist online for a predicted Scottish Premiership table. Opta stats do however do this for the top leagues such as England and Italy.
To try and get the buy-in of any xG sceptics reading this (thanks for subscribing Dad), I will reference a very good Scottish football analysis account on twitter called the Rangers Report, to show how prediction models can work. For several years that account has been posting predicted league standings throughout the season.
Their model has a very high rate of success, especially for projections that would have been ridiculed when they were released. For example, following Rangers winning the title undefeated in 2021, and despite new Celtic manager Ange Postecoglou losing his first three away games - the underlying data and their predicted tables still pointed to a Celtic title win, very early on in the season.
On December 23rd 2021, their model predicted Celtic would regain the title that year, with 93 points, with Rangers 2nd on 89 points. That is exactly what happened. The same projection had Hearts 3rd, Dundee relegated and St. Johnstone in the relegation playoff; all of which were correct.
The next year, on 4th September 2022, only 6 games into the season, their underlying data model predicted Celtic winning the title with 109 points (they hit 99) and Dundee United would be relegated, with Ross County in the relegation playoff, both of which were correct.
Last season, a good example would be how their model predicted Dundee United’s points tally. Despite a very strong start, the model consistently predicted United's points total to be at a much lower 53 points, an actual pace that United didn’t fall to until week 31. They finished on exactly 53 points.

Similarly, even when Hibs were bottom of the table last year, the underlying data model consistently expected Hibs to always finish way ahead of their actual pace for points, which of course they did, securing 3rd place on 58 points with games to spare.

After Aberdeen’s phenomenal start last season, the Rangers Report model predicted Aberdeen to finish no higher than third, and expected Hearts to improve dramatically when they were bottom of the table.
I use these examples to highlight that the ‘record’ of Rangers Report over the last few years has been consistently impressive, and to show the value in xG and xPts that I’ve discussed. Referencing the predicted table the Rangers Report posted at the end of December each season (so with half the season still to play), their projections had:
2020/21: 11 teams within 4 pts, 5 teams within 2 pts & 2 teams 100% accurate.
2021/22: 7 teams within 5 pts & 6 teams within 2 pts
2022/23: 9 teams within 5 pts & 7 teams within 3 pts
2023/24: 9 teams within 4 pts, 5 teams within 2 pts & 2 teams 100% accurate
Now, the account hasn’t posted any predictions this season - which may feel like a massive anti-climax after you’ve spent a few minutes reading my glowing appraisal of their work. However, I’ve reached out to them and they have confirmed they should start posting again in the next few weeks. Hurrah!
If they do, I will share their predictions on this website with their permission - to give us an indication of just how realistic the underlying data feels Hearts’ title charge is throughout the season….
My sincere thanks to you for being a paid supporter of my work. Lots of time and effort goes into my research and analysis, and I simply would not be able to continue without the support of the several hundred paid subscribers.
Genuinely, thank you so much!